Research Article | | Peer-Reviewed

Evaluation of the Performance of CORDEX-Africa Regional Climate Models in Simulating Rainfall and Temperature over the Lake Tana Sub-Basin, Ethiopia

Received: 15 June 2026     Accepted: 6 July 2026     Published: 28 July 2026
Views:       Downloads:
Abstract

Climate change is increasingly altering hydrological and climatic systems across the globe, with particularly severe consequences in Sub-Saharan Africa, where vulnerability is high and adaptive capacity remains limited. Ethiopia, and especially the Upper Blue Nile (Abay) Basin, is highly sensitive to climate variability because livelihoods, water resources, and agricultural production depend heavily on rainfall and temperature conditions. In this context, understanding the ability of climate models to simulate local climatic conditions is essential for generating reliable future climate projections and informing adaptation strategies. This study therefore evaluated the performance of three CORDEX-Africa regional climate models (RCMs) CCCma-CanESM2, MOHC-HadGEM2-ES, and MPI-M-MPI-ESM-LR in simulating rainfall and temperature over the Lake Tana sub-basin, one of the most important hydrological regions in Ethiopia. Observed rainfall and temperature data from four meteorological stations Bahir Dar, Gondar, Debre Tabor, and Dangla were used as reference data for the baseline period 1976-2005. The performance of the selected RCMs was assessed using widely applied statistical indicators, including Percentage Bias (PBIAS), Root Mean Square Error (RMSE), correlation coefficient (R), and coefficient of determination (R2). These metrics enabled the comparison of model outputs with observed climatic records in terms of magnitude, variability, and overall agreement. The evaluation results showed that the MPI-M-MPI-ESM-LR model outperformed the other two models in reproducing rainfall, maximum temperature, and minimum temperature across the study area, indicating its relatively higher suitability for climate impact analysis in the Lake Tana sub-basin. Future climate projections under Representative Concentration Pathways (RCP4.5 and RCP8.5) revealed a clear warming trend across the basin toward the end of the twenty-first century. Maximum temperature is projected to increase by about 3.2-4.4°C under the high-emission scenario (RCP8.5), while minimum temperature may rise even more substantially, by 6.4-7.9°C. In contrast, rainfall projections showed no consistent increasing or decreasing trend, suggesting considerable uncertainty in future precipitation patterns. Overall, the study emphasizes the importance of carefully selecting reliable regional climate models and applying bias correction techniques before using projected climate data for hydrological impact assessments, climate risk management, and long-term adaptation planning in climate-sensitive basins such as Lake Tana.

Published in American Journal of Biological and Environmental Statistics (Volume 12, Issue 2)
DOI 10.11648/j.ajbes.20261202.11
Page(s) 25-35
Creative Commons

This is an Open Access article, distributed under the terms of the Creative Commons Attribution 4.0 International License (http://creativecommons.org/licenses/by/4.0/), which permits unrestricted use, distribution and reproduction in any medium or format, provided the original work is properly cited.

Copyright

Copyright © The Author(s), 2026. Published by Science Publishing Group

Keywords

Climate Change, CORDEX-Africa, Lake Tana Basin, Rainfall, Temperature, RMSE, Ethiopia

1. Introduction
Climate change is no longer only a future concern; its impacts are already evident across the globe. According to the Intergovernmental Panel on Climate Change (IPCC), the global average temperature increased by approximately 0.85°C between 1880 and 2012 . Climate change has contributed to increasing occurrences of floods, droughts, heat waves, glacier melting, and extreme weather events . Sub-Saharan African countries are among the most vulnerable regions because of their high dependence on rain-fed agriculture and limited adaptive capacity . Climate change has become one of the greatest environmental challenges of the twenty-first century, affecting ecosystems, water resources, agriculture, and socio-economic development worldwide . Reliable regional climate projections are therefore essential for understanding future climate variability and supporting evidence-based adaptation planning.
Ethiopia is particularly vulnerable because its economy and food security depend heavily on rain-fed agriculture and climate-sensitive water resources . Previous investigations have demonstrated considerable spatial and temporal variability in rainfall and temperature across the Tana Basin, indicating the sensitivity of the region to ongoing climatic changes . The Lake Tana sub-basin is a critical hydrological region that supports irrigation, hydropower generation, biodiversity, and downstream water availability. Climate change may considerably affect streamflow and water-resource availability in the Upper Blue Nile Basin, with important implications for sustainable water management and regional development . Evaluating the performance of regional climate models before their application is therefore essential for producing reliable climate projections and informed decision-making .
Climate models are important tools for understanding future climate variability and supporting adaptation planning. General Circulation Models (GCMs) provide global climate projections but often have limitations at local scales because of their coarse spatial resolution . To address this limitation, the Coordinated Regional Climate Downscaling Experiment (CORDEX) was established to provide high-resolution regional climate information . Large CORDEX ensembles have demonstrated substantial spatial differences and uncertainties in projected precipitation across Africa, emphasizing the importance of regional-scale model evaluation . Evaluations of CORDEX regional climate models have also identified considerable differences in their ability to reproduce East African rainfall patterns . Regional climate projections developed for impact assessment studies further demonstrate the importance of carefully evaluated, high-resolution climate information for East Africa . Moreover, assessments of CORDEX regional climate models over East Africa indicate that model performance varies according to climatic variables, seasons, and geographical conditions, highlighting the need for model-specific validation .
CORDEX-Africa has been widely used to evaluate future climate scenarios in Africa and to support climate impact assessments . However, uncertainties associated with model structure, parameterization, and the representation of regional climatic processes require rigorous evaluation against observed meteorological data before model outputs are used for impact studies . Therefore, the objective of this study was to evaluate the performance of selected CORDEX-Africa regional climate models in simulating rainfall and temperature over the Lake Tana sub-basin in Ethiopia and to assess future climate change projections under RCP4.5 and RCP8.5 scenarios.
2. Study Area
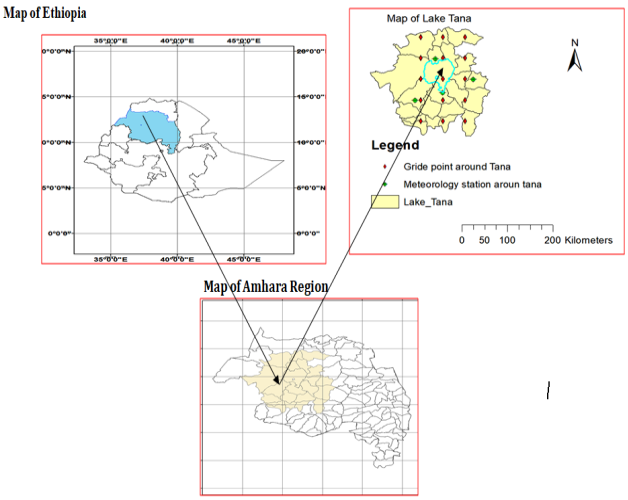
The Lake Tana Basin is located in northwestern Ethiopia between latitudes 10.95°N and 12.78°N and longitudes 36.89°E and 38.25°E. The total drainage area is approximately 15,000 km2. The basin receives an average annual rainfall of about 1280 mm, with the main rainy season occurring from June to September. The climate is predominantly tropical highland monsoon with a mean annual temperature of approximately 20°C .
The major tributaries of Lake Tana include the Gilgel Abay, Gumera, Rib, and Megech rivers, which contribute more than 93% of the lake inflow. The Blue Nile River originates from Lake Tana and plays a significant role in the hydrology of Ethiopia and downstream countries.
Figure 1. Location of the study area.
3. Methodology
Observed monthly rainfall and temperature data were obtained from the National Meteorological Service Agency of Ethiopia for Bahir Dar, Gondar, Debre Tabor, and Dangla stations. The study used data from 1976-2005 to evaluate model performance. Missing values were filled using arithmetic mean and interpolation methods.
Three CORDEX-Africa RCMs were selected for analysis: CCCma-CanESM2, MOHC-HadGEM2-ES, and MPI-M-MPI-ESM-LR. Model performance was evaluated using RMSE and PBIAS statistics following aproaches commonly applied in climate model evaluation studies .
The Root Mean Square Error (RMSE) was calculated using the following equation:
RMSE = √ [(Σ(Pi − Oi)2)/n]
Where Pi represents simulated values, Oi represents observed values, and n is the number of observations.
PBIAS was calculated as:
PBIAS = 100 × [Σ(Sim − Obs) / Σ(Obs)]
Where Sim represents simulated values and Obs represents observed values.
3.1. Data Type and Source
Temperature and precipitation Data obtained from CORDEX Africa, CCCma- CanESM2, MOHC-HadGEM2-ES, MPI-M-MPI-ESM-LR from 1951-2100.
a) Observed data
In Ethiopia, there are no long meteorological time-series data available, although the country did expand the number of meteorological stations following the drought of the mid-1980s. Therefore, for this study, monthly air temperature and rainfall data obtained from the National Meteorological Service Agency of Ethiopia were used, Monthly rainfall and temperature of four stations: Bahir Dar, (1961-2021) Gonder (1952-2021), D/Tabor (1951-2021) and Dangla (1954- 2021).
The continuity of a record broken some years ago in all stations (missing data due to the absence of the observer and failed instrument) Therefore, it is necessary to use the nearest year data and estimate, complete the missing data. In order to minimize the error and accurately represent the study area, we used data from 1976-2005, which covers 30 years of data. It also has some missing values.
To fill this data we use the arithmetic mean method and interpolation IDW by using Dangla station from 1978 and 1984-1987, where all data were missed and cross-validation procedure was used to fill the temperature data using the mean from 1983.
3.2. Data Processing and Statistical Analysis
1) Observed station data and model outputs were organized on a monthly basis for the common baseline period (1976-2005). Where station observations were missing, the records were completed using arithmetic mean and inverse distance weighting (IDW) methods, depending on the data availability and spatial context.
2) Model performance was evaluated by comparing simulated and observed values using several statistical indicators, including the root mean square error (RMSE), percent bias (PBIAS), correlation coefficient (R), and coefficient of determination (R2). These metrics were used to quantify the accuracy, agreement, and overall explanatory power of each model.
3) Beyond the statistical evaluation, visual comparisons were conducted between observed and simulated monthly rainfall, maximum temperature, and minimum temperature. These comparisons were used to assess how effectively each model reproduced the seasonal variability of hydro-climatic conditions in the Lake Tana sub-basin.
4. Results and Discussion
4.1. Mean Monthly Air Temperature Cycle
a) Mean monthly maximum air temperature cycle
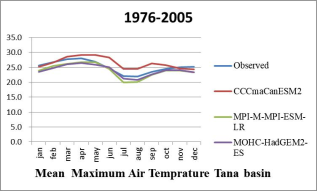
Figure 2. Mean maximum air temperature.
Figure 1 illustrates the mean monthly maximum air temperature cycle in the Lake Tana Basin and compares the performance of different climate models in simulating observed temperature patterns. The results indicate that the Canadian Centre for Climate Modelling and Analysis-CanESM2 and Met Office Hadley Centre-HadGEM2-ES models failed to adequately reproduce the observed maximum air temperature trends in the study area. In contrast, the MPI-M-MPI-ESM-LR model demonstrated relatively better performance in capturing the variability of maximum air temperatures. This suggests that model performance varies considerably depending on regional climatic characteristics and model sensitivity.
Furthermore, all climate models simulated the seasonal pattern of maximum monthly air temperatures from January to December, although differences in accuracy were observed. The simulation results indicate that maximum temperatures followed a clear annual cycle, with warmer conditions dominating during some months and cooler conditions during others. While the general temperature trend was represented by all models, discrepancies existed in the magnitude and timing of simulated temperatures. Such variations may be attributed to differences in model parameterization and representation of atmospheric processes.
The analysis also revealed that maximum air temperatures gradually decreased between May and September, indicating a cooling period associated with seasonal climatic conditions in the Lake Tana Basin. The lowest maximum air temperature was recorded in August, which may be linked to increased cloud cover, rainfall, and reduced solar radiation during the rainy season. After September, temperatures showed a tendency to increase again as seasonal weather conditions changed. These findings highlight the importance of selecting appropriate climate models for accurate regional climate assessment and temperature prediction.
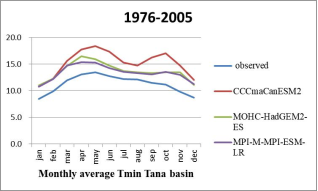
Figure 3. Mean minimum Temperature.
b) Mean monthly minimum air temperature cycle
Figure 3 illustrates the mean monthly minimum air temperature cycle of the Tana Basin and compares the performance of different climate models in simulating observed temperature patterns. The results indicate noticeable variations among the models in reproducing the seasonal minimum air temperature cycle across the basin. Accurate simulation of minimum air temperature is essential for understanding climate variability and its influence on hydrological and environmental processes in the study area. The figure highlights how closely each climate model corresponds with observed temperature trends during different months of the year. Such comparisons are important for evaluating the reliability of climate projections for future environmental studies.
The results further reveal that the Canadian Centre for Climate Modelling and Analysis-CanESM2 and Met Office Hadley Centre HadGEM2-ES climate models generally overestimated the monthly minimum air temperature in the Tana Basin. This overestimation suggests that these models simulated higher minimum temperature values than those observed across several months. The discrepancy may be associated with model parameterization, regional climatic complexity, or differences in the representation of atmospheric processes. Consequently, caution should be exercised when interpreting temperature projections generated from these models for localized climate impact assessments.
In contrast, the MPI-M-MPI-ESM-LR model simulated the monthly minimum air temperature relatively well across all months of the year. Its performance demonstrates a closer agreement with observed temperature patterns, suggesting better representation of local climatic conditions in the basin. This relatively strong model performance indicates its potential suitability for climate variability and climate change studies in the Tana Basin region. Therefore, the MPI-M-MPI-ESM-LR model may provide more reliable information for climate-related planning, hydrological assessment, and environmental decision-making processes.
4.2. Mean Monthly Rainfall Cycle
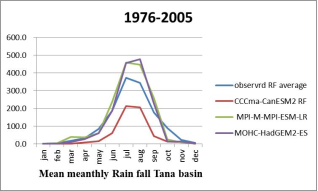
Figure 4. Mean monthly rain fall.
4.3. Mean Annual Rainfall Climate
Figure 4 shows the mean monthly rainfall cycle of the Lake Tana Basin and compares the performance of different climate models in simulating rainfall patterns. The results indicate that the CCCma-CanESM2 model overestimated monthly rainfall amounts compared to the observed values. In contrast, the rainfall values simulated by the MOHC-HadGEM2-ES model were nearly comparable to those of the MPI-M-MPI-ESM-LR model. This suggests that both models showed relatively similar performance in representing the rainfall distribution across the months. However, differences in model performance were observed depending on the season and rainfall intensity.
Among the evaluated models, the MPI-M-MPI-ESM-LR model demonstrated better performance due to its lower root mean square error (RMSE) value compared to the other models. A lower RMSE indicates that the predicted values are closer to the observed rainfall records, suggesting improved simulation accuracy. Therefore, this model can be considered more reliable for representing rainfall variability in the Lake Tana Basin. The MOHC-HadGEM2-ES model also showed acceptable performance, as its simulated values were relatively close to those of MPI-M-MPI-ESM-LR. This highlights the suitability of these models for climate-related studies in the basin.
Furthermore, the MPI-M-MPI-ESM-LR model simulated climatic conditions more accurately across different months than the other models included in the analysis. Although the original simulation focused on rainfall, the model also showed better consistency in representing monthly climatic variability. Compared with the other models, MPI-M-MPI-ESM-LR provided more stable and reliable results, making it useful for climate prediction and environmental assessments. Its relatively accurate performance suggests that it may be appropriate for future climate change studies in the Lake Tana Basin. Overall, the model demonstrated stronger agreement with observed climate patterns than the other evaluated models.
Table 1. Mean annual rain fall simulation.

Stations Performance Statistic

CCCmaCanESM2

MOHC- HadGEM2-ES

MPI-M-MPI-ESM- LR

Lake tana basin RMSE

4.1

0.3

0.1

PBIAS

-0.2

-0.3

0.07

The performance of the climate models presented in Table 1 indicates variations in their ability to simulate mean annual rainfall in the Upper Blue Nile-Tana Basin of Ethiopia. The CCCmaCanESM2 model showed a root mean square error (RMSE) value of 4 and a PBIAS value of -0.2, indicating that the model slightly overestimated the mean annual rainfall. This suggests that although the model can represent rainfall patterns, some level of systematic deviation exists. Similarly, the MOHC-HadGEM2-ES model demonstrated an RMSE value of 0.3 and a PBIAS value of -0.3, indicating relatively better model performance with lower prediction error. These findings highlight the importance of evaluating model accuracy before applying climate projections in hydrological and environmental studies.
The MPI-M-MPI-ESM-LR model showed nearly accurate simulation of annual rainfall patterns in the Upper Blue Nile-Tana Basin of Ethiopia when compared with the observed climate data. However, in terms of percentage bias (PBIAS), the MPI-M-MPI-ESM-LR model demonstrated relatively higher bias compared to the other models, suggesting the presence of systematic deviations in rainfall estimation. Such bias may influence the reliability of climate projections if left uncorrected. Therefore, model outputs should be carefully examined and adjusted to improve their predictive performance. A detailed assessment of model uncertainties is essential to ensure the reliability of climate-related decision-making and research findings.
To minimize the observed biases in climate model outputs, different bias correction techniques can be applied to improve the accuracy of rainfall simulations. Climate data bias correction software and statistical approaches are commonly used to reduce systematic errors in climate model predictions. In this study, the highest PBIAS values were observed in the MPI-M-MPI-ESM-LR and CCCmaCanESM2 models, with values of 0.07 and -0.2, respectively. These results indicate the need for additional calibration and adjustment procedures to improve model reliability. Applying appropriate correction techniques can significantly enhance the usefulness of climate model data for hydrological analysis, climate change studies, and water resource management in Ethiopia.
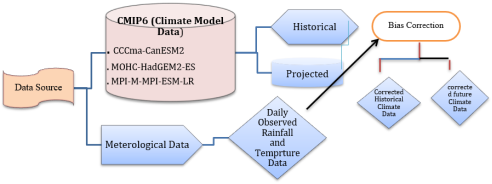
Figure 5. Methodological framework.
4.4. Maximum Mean Annual Air Temperature Climate
Table 2. Mean annual maximum temperature.

Stations Performance Statistic

CCCmaCanESM2

MOHC- HadGEM2-ES

MPI-M-MPI- ESM-LR

Lake tana basin RME

1.39

1.44

1.34

PBIAS

0.1

-0.02

-0.1

The MPI-M-MPI-ESM-LR model demonstrated comparatively better performance over the study area than the other regional climate models (RCMs) evaluated in this study. The model showed a stronger agreement with observed climatic conditions, indicating its higher capability in simulating temperature variability across the region. In comparison, most of the other climate models tended to overestimate the mean annual maximum air temperature, resulting in noticeable deviations from observed measurements. This overestimation suggests potential uncertainties in model simulations and highlights differences in model sensitivity to regional climatic conditions. Therefore, the MPI-M-MPI-ESM-LR model appears to provide relatively more reliable temperature estimates for the study area.
Most of the regional climate models included in this analysis exhibited a tendency to over predict mean annual maximum air temperature across the study area. Such overestimation may be associated with uncertainties in model parameterization, regional climatic complexity, or limitations in representing local environmental conditions. Despite these discrepancies, some models demonstrated closer agreement with observed data than others. For example, the minimum bias value observed was −0.02 in the MOHC-HadGEM2-ES model, indicating a relatively strong correspondence with measured temperature data. This comparatively small bias suggests that the model has a better capacity to reproduce observed climatic patterns with minimal deviation.
Conversely, the highest bias value recorded was 0.10 in the CCCmaCanESM2 model, implying a comparatively greater divergence from observed temperature conditions. This higher positive bias indicates that the model substantially overestimated mean annual maximum temperature, which may reduce its reliability for climate impact assessments and local-scale applications. Furthermore, significant negative bias values observed in certain locations revealed that some models considerably underestimated temperature conditions, reflecting inconsistencies in model performance. These findings indicate the presence of substantial model uncertainty and reduced simulation accuracy in specific areas, emphasizing the importance of careful model selection and validation for climate-related studies.
4.5. Minimum Mean Annual Air Temperature Climate
Table 3. Statistical mean minimum air temperature.

Stations Performance Statistic

CCCmaCanESM2

MOHC- HadGEM2-ES

MPI-M-MPI- ESM-LR

Lake tana basin RMSE

4

3.4

2.3

PBIAS

1.5

-2.8

1.2

The analysis revealed relatively large values of bias and root mean square error (RMSE), estimated at 1.5 and 4, respectively, for the CCCma CanESM2 model. These results indicate that the model tended to overestimate the mean annual minimum air temperature when compared with observed meteorological data. The magnitude of the bias suggests systematic deviation between simulated and observed temperature values. Similarly, the high RMSE value reflects substantial differences between predicted and measured observations across the study period. This implies that the model may have limitations in accurately reproducing local minimum temperature conditions without further calibration or bias correction.
In general, almost all evaluated climate models demonstrated a tendency to overestimate the mean annual minimum air temperature relative to the observed dataset. This consistent overestimation indicates the presence of systematic uncertainty in model simulations for minimum temperature representation. Variations in model structure, parameterization, and spatial resolution may contribute to discrepancies between simulated and observed climatic conditions. Such differences are common in climate modeling studies, especially when global climate models are applied at regional or basin scales. Therefore, careful validation and comparison with observed station data remain essential for improving model reliability.
Among the evaluated models, MPI-M MPI-ESM-LR showed comparatively better performance and appeared to provide results that were closer to the observed data. This suggests that the model generated more accurate estimations of minimum mean annual air temperature than the other assessed models. Its relatively small deviation from observed values indicates a stronger agreement with real climatic conditions in the study area. Consequently, this model may be considered more suitable for representing historical minimum temperature variability and for future climate-related assessments. However, additional validation using different statistical performance indicators would further strengthen confidence in its performance.
4.6. Evaluating the Performance of RCM
4.6.1. Statistical Criteria
The performance of the RCM model was assessed using different statistical methods such as RMSE, R and R2 value. The RMSE is one of the error indices and is used to measure the difference between observed and simulated values. The RMSE value of 0 represents the perfect fit.
4.6.2. Comparison of Observed and Simulated Maximum and Minimum Temperature
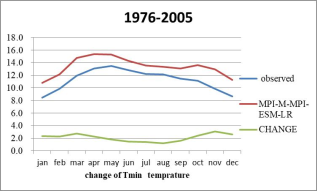
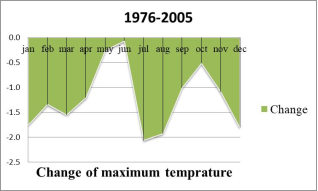
In addition to statistical tests, the performance of the RCM temperature validation period from 1976 to 2005 for 30 years is shown in Figure 6. Therefore, a visual comparison between the monthly observed and simulated data was made using graphs.
Figure 6. Change of minimum temperature.
The aim of this graph is to show the difference in temperature between the selected simulated and observed values. There is a change in temperature between the observed maximum air temperature and the selected model, and between the observed minimum air temperature and the selected minimum air temperature model. Climate scientists call this an error, so we know there is a change in temperature. We can minimize it by using different techniques.
Figure 7. Change of Max temp.
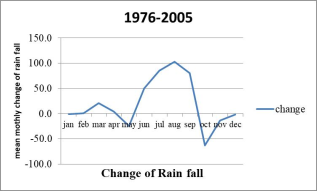
From this graph we understand that there is difference between the observed and simulated model and between June to September there is high difference between the model and observed value from the rest season from 1976-2005 monthly average rainfall.
Figure 8. Change of Rainfall.
4.7. Projection of Maximum Temperature
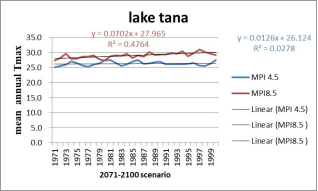
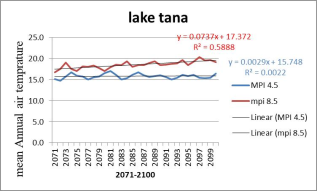
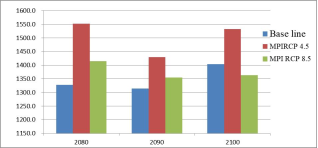
The projected maximum temperature portrays an increasing trend in mean annual maximum temperature in the future time periods and scenarios Figure 7) For instance, the mean annual maximum temperature under RCP 4.5 and RCP 8.5 in future time period (scenarios) temperature in the Lake Tana basin have shown a positive trends at different level of Significance. The RCP8.5 scenario shows the highest increase compared to other scenarios.
Figure 9. Maximum Temperature Scenario.
Figure 10. Difference between Base line period and T Max Projection.
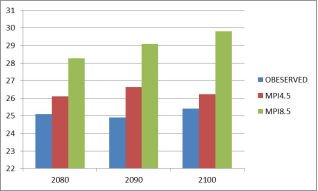
The projection of maximum temperature change for the Lake Tana Basin of Ethiopia, compared to the baseline period, is presented in Figure 9. The projected results indicate a consistent increasing trend in mean annual maximum temperature across future time periods and climate scenarios. This increase suggests that the basin is likely to experience warmer climatic conditions in the coming decades, which may significantly influence hydrological processes, ecosystems, and socio-economic activities dependent on climate-sensitive resources. The warming trend is projected under both moderate and high greenhouse gas emission pathways, indicating that climate change impacts are expected to intensify over time. Such temperature increases may also affect water availability, agricultural productivity, biodiversity, and human livelihoods in the Lake Tana Basin.
Under the RCP 4.5 scenario, the projected mean annual maximum temperature is expected to increase gradually during future periods. Specifically, the maximum temperature is projected to rise by approximately 1°C by the 2080s and by about 1.7°C by the 2090s in the Lake Tana Basin of Ethiopia. These projected increases demonstrate a moderate warming trend under a stabilized emission pathway, suggesting that even under mitigation-oriented scenarios, temperature rise remains unavoidable. Increased temperatures may contribute to higher evapotranspiration rates, reduced soil moisture, and increased heat stress on crops and livestock. Consequently, these changes may create challenges for water resource management and agricultural sustainability in the basin.
The RCP 8.5 scenario shows a substantially higher increase in maximum temperature compared to the RCP 4.5 scenario, indicating more severe climate change impacts under high greenhouse gas emissions. Under this scenario, the mean annual maximum temperature is projected to increase by approximately 3.2°C in the 2080s, 4.2°C in the 2090s, and 4.4°C by the 2100s. In general, the projected increase in maximum temperature highlights the urgent need for effective climate change mitigation and adaptation strategies. Therefore, the government, local communities, and relevant stakeholders should strengthen efforts to reduce greenhouse gas emissions and implement adaptive measures to minimize the adverse impacts of climate change on the environment, agriculture, and livelihoods in the Lake Tana Basin.
4.8. Projection of Minimum Temperature
The mean annual minimum temperature projection change in the future time periods and scenarios are shown in Figure 6 The mean annual minimum temperature under RCP4.5 and RCP 8.5 minimum temperature tends to increase.
Figure 11. Mean annual Air Tmin.
Figure 12. Difference of base line and projected Tmin.
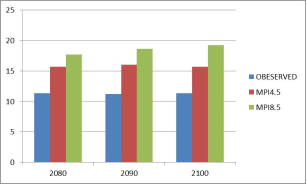
The projected changes in mean annual minimum temperature for future time periods under different climate scenarios are presented in Figure 7. The findings indicate a significant increase in minimum temperature over the Lake Tana region, Ethiopia, compared to the baseline period. Under the RCP4.5 scenario, the mean annual minimum temperature is projected to increase by approximately 4.4°C in the 2080s. This warming trend is expected to continue, reaching about 4.8°C in the 2090s, before slightly decreasing to around 4.4°C by 2100. These results suggest a persistent increase in nighttime and cooler-period temperatures under a moderate greenhouse gas emission pathway.
Similarly, under the RCP8.5 scenario, which represents a high greenhouse gas emission pathway, the projected increase in mean annual minimum temperature is considerably higher. The results show that minimum temperature is expected to rise by about 6.4°C in the 2080s compared to the baseline period. This increase is projected to intensify further, reaching approximately 7.4°C during the 2090s and 7.9°C by 2100. Such substantial warming indicates a stronger climate change signal under the high-emission scenario and highlights the increased vulnerability of the Lake Tana basin to future climatic variability.
The projected rise in minimum temperature under both scenarios may have important environmental, hydrological, and socio-economic implications for the Lake Tana region. Increased minimum temperatures can alter ecosystem functioning, affect agricultural productivity, and influence water availability by changing evaporation and hydrological processes. Furthermore, warmer nighttime temperatures may impact biodiversity and increase climate-related risks for local communities dependent on natural resources. Therefore, understanding these projected temperature changes is essential for developing effective climate adaptation and resilience strategies in the region.
4.9. Projection of Rainfall
Figure 13. Difference of base line and projected RF scenario.
Figure 14. Mean Annual Rainfall by using trend line test.
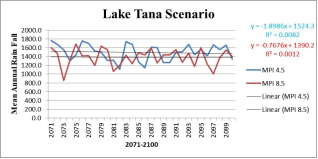
The projection of precipitation did not show a consistent increasing or decreasing trend across all future time periods and climate scenarios, as illustrated in Figure 13. Variations in precipitation patterns were observed depending on the scenario and projected period, indicating uncertainty in future rainfall behavior in the study area. Despite these fluctuations, the overall projection suggests a possible decline in mean daily precipitation across the Lake Tana Basin. This reduction in rainfall may have important implications for water resources, agriculture, and ecosystem sustainability in the basin. Therefore, understanding future precipitation variability is essential for climate adaptation and resource management planning.
On average, the climate model projected a decrease in mean daily precipitation under all scenarios and throughout the future periods considered in the study. Under the RCP4.5 scenario, mean daily precipitation is projected to decrease by approximately 0.61 mm/day during the 2080s, 0.32 mm/day during the 2090s, and 0.35 mm/day by the 2100s. These findings indicate a moderate but persistent reduction in rainfall over time. Such reductions may contribute to water scarcity, reduced agricultural productivity, and changes in hydrological processes within the Lake Tana Basin. Consequently, policymakers and environmental planners should consider adaptive measures to mitigate potential impacts.
Similarly, under the RCP8.5 scenario, mean daily precipitation is projected to decrease by 0.24 mm/day in the 2080s, 0.11 mm/day in the 2090s, and -0.11 mm/day by the 2100s. Although the projected decrease under RCP8.5 appears relatively smaller compared to RCP4.5, the declining trend still highlights the possibility of reduced rainfall in the future. Changes in precipitation distribution and intensity may further influence water availability, agricultural activities, and ecosystem resilience in the Lake Tana Basin. These projections emphasize the need for climate-resilient planning and sustainable water resource management strategies to address future climate-related challenges.
5. Conclusion
This study evaluated the performance of selected CORDEX-Africa regional climate models in simulating rainfall and temperature over the Lake Tana sub-basin. The findings showed that the MPI-M-MPI-ESM-LR model performed better than the other models considered in this study. Temperature projections indicated substantial warming trends under both RCP4.5 and RCP8.5 scenarios, while rainfall projections remained uncertain.
The study demonstrates the importance of evaluating and bias-correcting climate models before applying them in climate impact assessments and adaptation planning. Reliable climate projections are essential for water resource management, agricultural planning, and climate resilience strategies in the Lake Tana Basin and the broader Upper Blue Nile Basin.
5.1. Recommendation
Strengthen the use of bias correction techniques before applying Regional Climate Model (RCM) outputs for climate impact assessment, since the study identified systematic deviations and biases among the CORDEX-Africa models, particularly for rainfall and minimum temperature simulations.
Government institutions and local communities in the Lake Tana Basin should implement climate change adaptation and mitigation strategies, including greenhouse gas emission reduction, climate-smart agriculture, and sustainable water resource management, because projected temperatures are expected to rise significantly under both RCP4.5 and RCP8.5 scenarios.
Future climate studies should incorporate additional meteorological stations, longer observation periods, and higher-resolution climate datasets to improve the accuracy and spatial representation of rainfall and temperature projections in the Upper Blue Nile Basin.
Researchers and policymakers should prioritize the use of the MPI-M-MPI-ESM-LR model for climate projection studies in the study area because it demonstrated relatively better performance in simulating observed rainfall and temperature compared to the other evaluated models.
Sectoral planning for agriculture, hydropower generation, and water resources in the Upper Blue Nile Basin should integrate future climate variability and uncertainty into development plans, especially considering the projected increase in temperature and inconsistent rainfall patterns that may affect food security and water availability.
5.2. Limitations of the Study
This study was limited to three CORDEX-Africa regional climate models and four meteorological stations for the baseline period (1976–2005). Although the selected models provided useful insights, additional models, longer observational records, more stations, and advanced bias-correction methods could further improve the robustness and spatial representation of future climate projections.
Abbreviations

CORDEX

Coordinated Regional Climate Downscaling Experiment

RCM

Regional Climate Model

GCM

General Circulation Model

RCP

Representative Concentration Pathway

RMSE

Root Mean Square Error

PBIAS

Percentage Bias

IPCC

Intergovernmental Panel on Climate Change

NMSA

National Meteorological Service Agency

MPI

Max Planck Institute

MOHC

Met Office Hadley Centre

CCCma

Canadian Centre for Climate Modeling and Analysis

ESM

Earth System Model

IDW

Inverse Distance Weighting

Acknowledgments
I would like to express my sincere gratitude to my family, especially my father, Gobeze Mengiste, for his invaluable moral and financial support throughout my educational journey. I also sincerely thank my aunt, Amare Mengistu, for her encouragement, financial assistance, and continuous support during my studies.
Author Contributions
Behabtu Gobeze Mengiste: Conceptualization, Data curation, Formal Analysis, Investigation, Methodology, Resources, Validation, Visualization, Writing – original draft, Writing – review & editing
Yingesu Lema Mengiste: Writing – review & editing
Temesgen Admasu Yazachew: Writing – review & editing
Abebe Chalew Haile: Supervision, Writing – review & editing
Data Availability Statement
The datasets generated and analyzed during the current study are available from the corresponding author upon reasonable request.
Conflicts of Interest
The author declares that there is no conflict of interest.
References
[1] Birara, H., Pandey, R. P., & Mishra, S. K. (2018). Trend and variability analysis of rainfall and temperature in the Tana Basin region, Ethiopia. Journal of Water and Climate Change, 9(3), 555-569.
[2] Conway, D., & Schipper, E. L. F. (2011). Adaptation to climate change in Africa: Challenges and opportunities identified from Ethiopia. Global Environmental Change, 21(1), 227-237.
[3] Demissie, T. A., & Sime, C. H. (2021). Assessment of the performance of CORDEX regional climate models in simulating rainfall and air temperature over southwest Ethiopia. Heliyon, 7(8), e07791.
[4] Dibaba, W. T., Demissie, T. A., & Miegel, K. (2019). Watershed hydrological response to combined land use/land cover and climate change in highland Ethiopia. Water, 11(8), 1803.
[5] Dosio, A., Jones, R. G., Jack, C., Lennard, C., Nikulin, G., & Hewitson, B. (2015). What can we know about future precipitation in Africa? Robustness, significance and added value of projections from a large CORDEX ensemble. Climate Dynamics, 44, 583-598.
[6] Endris, H. S., et al. (2013). Assessment of the performance of CORDEX regional climate models in simulating East African rainfall. Journal of Climate, 26(21), 8453-8475.
[7] Gebrechorkos, S. H., Hülsmann, S., & Bernhofer, C. (2019). Regional climate projections for impact assessment studies in East Africa. Environmental Research Letters, 14(4), 044031.
[8] Getachew, B., & Manjunatha, B. R. (2021). Climate change projections and trends simulated from the CMIP5 models for the Lake Tana sub-basin, the Upper Blue Nile Basin, Ethiopia. Environmental Challenges, 5, 100361.
[9] Giorgi, F., Jones, C., & Asrar, G. R. (2009). Addressing climate information needs at the regional level: The CORDEX framework. WMO Bulletin, 58(3), 175-183.
[10] IPCC. (2013). Climate Change 2013: The Physical Science Basis. Cambridge University Press.
[11] IPCC. (2021). Climate Change 2021: The Physical Science Basis. Cambridge University Press.
[12] Kløve, B., et al. (2014). Climate change impacts on water and agriculture in Africa. Current Opinion in Environmental Sustainability, 5(3-4), 248-256.
[13] Nikulin, G., et al. (2012). Precipitation climatology in an ensemble of CORDEX-Africa regional climate simulations. Journal of Climate, 25(18), 6057-6078.
[14] Ongoma, V., et al. (2018). Evaluation of CORDEX regional climate models over East Africa. Theoretical and Applied Climatology, 131, 537-548.
[15] Worqlul, A. W., Collick, A. S., Langan, S., & Steenhuis, T. S. (2021). Climate change impacts on streamflow and water resources in the Upper Blue Nile Basin: a review. Heliyon, 7(10), e08162.
Cite This Article
  • APA Style

    Mengiste, B. G., Mengste, Y. L., Yazachew, T. A., Haile, A. C. (2026). Evaluation of the Performance of CORDEX-Africa Regional Climate Models in Simulating Rainfall and Temperature over the Lake Tana Sub-Basin, Ethiopia. American Journal of Biological and Environmental Statistics, 12(2), 25-35. https://doi.org/10.11648/j.ajbes.20261202.11

    Copy | Download

    ACS Style

    Mengiste, B. G.; Mengste, Y. L.; Yazachew, T. A.; Haile, A. C. Evaluation of the Performance of CORDEX-Africa Regional Climate Models in Simulating Rainfall and Temperature over the Lake Tana Sub-Basin, Ethiopia. Am. J. Biol. Environ. Stat. 2026, 12(2), 25-35. doi: 10.11648/j.ajbes.20261202.11

    Copy | Download

    AMA Style

    Mengiste BG, Mengste YL, Yazachew TA, Haile AC. Evaluation of the Performance of CORDEX-Africa Regional Climate Models in Simulating Rainfall and Temperature over the Lake Tana Sub-Basin, Ethiopia. Am J Biol Environ Stat. 2026;12(2):25-35. doi: 10.11648/j.ajbes.20261202.11

    Copy | Download

  • @article{10.11648/j.ajbes.20261202.11,
      author = {Behabtu Gobeze Mengiste and Yingesu Lemma Mengste and Temesgen Admasu Yazachew and Abebe Chalew Haile},
      title = {Evaluation of the Performance of CORDEX-Africa Regional Climate Models in Simulating Rainfall and Temperature over the Lake Tana Sub-Basin, Ethiopia},
      journal = {American Journal of Biological and Environmental Statistics},
      volume = {12},
      number = {2},
      pages = {25-35},
      doi = {10.11648/j.ajbes.20261202.11},
      url = {https://doi.org/10.11648/j.ajbes.20261202.11},
      eprint = {https://article.sciencepublishinggroup.com/pdf/10.11648.j.ajbes.20261202.11},
      abstract = {Climate change is increasingly altering hydrological and climatic systems across the globe, with particularly severe consequences in Sub-Saharan Africa, where vulnerability is high and adaptive capacity remains limited. Ethiopia, and especially the Upper Blue Nile (Abay) Basin, is highly sensitive to climate variability because livelihoods, water resources, and agricultural production depend heavily on rainfall and temperature conditions. In this context, understanding the ability of climate models to simulate local climatic conditions is essential for generating reliable future climate projections and informing adaptation strategies. This study therefore evaluated the performance of three CORDEX-Africa regional climate models (RCMs) CCCma-CanESM2, MOHC-HadGEM2-ES, and MPI-M-MPI-ESM-LR in simulating rainfall and temperature over the Lake Tana sub-basin, one of the most important hydrological regions in Ethiopia. Observed rainfall and temperature data from four meteorological stations Bahir Dar, Gondar, Debre Tabor, and Dangla were used as reference data for the baseline period 1976-2005. The performance of the selected RCMs was assessed using widely applied statistical indicators, including Percentage Bias (PBIAS), Root Mean Square Error (RMSE), correlation coefficient (R), and coefficient of determination (R2). These metrics enabled the comparison of model outputs with observed climatic records in terms of magnitude, variability, and overall agreement. The evaluation results showed that the MPI-M-MPI-ESM-LR model outperformed the other two models in reproducing rainfall, maximum temperature, and minimum temperature across the study area, indicating its relatively higher suitability for climate impact analysis in the Lake Tana sub-basin. Future climate projections under Representative Concentration Pathways (RCP4.5 and RCP8.5) revealed a clear warming trend across the basin toward the end of the twenty-first century. Maximum temperature is projected to increase by about 3.2-4.4°C under the high-emission scenario (RCP8.5), while minimum temperature may rise even more substantially, by 6.4-7.9°C. In contrast, rainfall projections showed no consistent increasing or decreasing trend, suggesting considerable uncertainty in future precipitation patterns. Overall, the study emphasizes the importance of carefully selecting reliable regional climate models and applying bias correction techniques before using projected climate data for hydrological impact assessments, climate risk management, and long-term adaptation planning in climate-sensitive basins such as Lake Tana.},
     year = {2026}
    }
    

    Copy | Download

  • TY  - JOUR
    T1  - Evaluation of the Performance of CORDEX-Africa Regional Climate Models in Simulating Rainfall and Temperature over the Lake Tana Sub-Basin, Ethiopia
    AU  - Behabtu Gobeze Mengiste
    AU  - Yingesu Lemma Mengste
    AU  - Temesgen Admasu Yazachew
    AU  - Abebe Chalew Haile
    Y1  - 2026/07/28
    PY  - 2026
    N1  - https://doi.org/10.11648/j.ajbes.20261202.11
    DO  - 10.11648/j.ajbes.20261202.11
    T2  - American Journal of Biological and Environmental Statistics
    JF  - American Journal of Biological and Environmental Statistics
    JO  - American Journal of Biological and Environmental Statistics
    SP  - 25
    EP  - 35
    PB  - Science Publishing Group
    SN  - 2471-979X
    UR  - https://doi.org/10.11648/j.ajbes.20261202.11
    AB  - Climate change is increasingly altering hydrological and climatic systems across the globe, with particularly severe consequences in Sub-Saharan Africa, where vulnerability is high and adaptive capacity remains limited. Ethiopia, and especially the Upper Blue Nile (Abay) Basin, is highly sensitive to climate variability because livelihoods, water resources, and agricultural production depend heavily on rainfall and temperature conditions. In this context, understanding the ability of climate models to simulate local climatic conditions is essential for generating reliable future climate projections and informing adaptation strategies. This study therefore evaluated the performance of three CORDEX-Africa regional climate models (RCMs) CCCma-CanESM2, MOHC-HadGEM2-ES, and MPI-M-MPI-ESM-LR in simulating rainfall and temperature over the Lake Tana sub-basin, one of the most important hydrological regions in Ethiopia. Observed rainfall and temperature data from four meteorological stations Bahir Dar, Gondar, Debre Tabor, and Dangla were used as reference data for the baseline period 1976-2005. The performance of the selected RCMs was assessed using widely applied statistical indicators, including Percentage Bias (PBIAS), Root Mean Square Error (RMSE), correlation coefficient (R), and coefficient of determination (R2). These metrics enabled the comparison of model outputs with observed climatic records in terms of magnitude, variability, and overall agreement. The evaluation results showed that the MPI-M-MPI-ESM-LR model outperformed the other two models in reproducing rainfall, maximum temperature, and minimum temperature across the study area, indicating its relatively higher suitability for climate impact analysis in the Lake Tana sub-basin. Future climate projections under Representative Concentration Pathways (RCP4.5 and RCP8.5) revealed a clear warming trend across the basin toward the end of the twenty-first century. Maximum temperature is projected to increase by about 3.2-4.4°C under the high-emission scenario (RCP8.5), while minimum temperature may rise even more substantially, by 6.4-7.9°C. In contrast, rainfall projections showed no consistent increasing or decreasing trend, suggesting considerable uncertainty in future precipitation patterns. Overall, the study emphasizes the importance of carefully selecting reliable regional climate models and applying bias correction techniques before using projected climate data for hydrological impact assessments, climate risk management, and long-term adaptation planning in climate-sensitive basins such as Lake Tana.
    VL  - 12
    IS  - 2
    ER  - 

    Copy | Download

Author Information
  • Department of Environment and Climate Change, Ethiopia Road Administration, Addis Ababa, Ethiopia
  • Department of Other Health Sciences, Paulo’s Hospital, Addis Ababa, Ethiopia

  • Department of Social Development, Ethiopia Road Administration, Addis Ababa, Ethiopia

  • Department of Social Development, Ethiopia Road Administration, Addis Ababa, Ethiopia

  • Abstract
  • Keywords
  • Document Sections

    1. 1. Introduction
    2. 2. Study Area
    3. 3. Methodology
    4. 4. Results and Discussion
    5. 5. Conclusion
    Show Full Outline
  • Abbreviations
  • Acknowledgments
  • Author Contributions
  • Data Availability Statement
  • Conflicts of Interest
  • References
  • Cite This Article
  • Author Information